Introduction
Radius and ulna shaft fractures are among the most common upper extremity fractures in the United States, accounting for over 600,000 fracture cases every year.1–3 Radius and ulna shaft fractures are generally thought of as predominantly occurring in the pediatric patient population, with the highest incidence in children between ages 5-14, with incidence dropping over age 16 and with increasing age.4–8 Radius and Ulnar shaft fractures account for 3% to 6% of all fractures in children.8–12 Additionally, highly active athletes in high school, as well as adults sustaining high-energy trauma, are at risk for radius and ulnar shaft fractures.13,14 A major complication of radius and ulna shaft fractures is fracture nonunion, with rates of nonunion reported between 2-10% in the United States.15–18 Nonunion of radius and ulna shaft fractures also presents a challenge to orthopedic surgeons. Even after surgical correction of the nonunion, many patients still do not achieve an optimal functional outcome.19 Previous studies have demonstrated that nonunion of the radius and ulna have the lowest quality of life outcome compared to nonunion of all other long bone fractures, with a quality of life comparable to stroke or type 1 diabetes mellitus.20,21 The incidence rate of radius and ulna shaft fractures in the pediatric population has been increasing in recent decades, with overall incidence by over four-fold between 2000 and 2009.22,23 This trend only serves to increase healthcare costs, lost time in work and school, as well as overall patient disability.23–26 With the rapidly changing demographic in the United States and predicted increase in overall fracture burden, understanding the underlying demographic factors that affect radius and ulnar shaft fractures is key to ensuring patients receive high-quality patient care.
This study aims to assess the demographic factors related to radius and ulna shaft fractures, nonunion rate, and nonunion surgery using the TriNetX database.
Method
A retrospective study was performed utilizing the TriNetX “Global Collaborative Network” database, queried in the United States in November 2023. The specific patient data from this TriNetX has been deidentified; thus, it is exempt from the Institutional Review Board. Patient cohorts were formed with the 10th edition of the International Classification of Diseases (ICD10) diagnostic codes for the respective radius and ulna shaft fractures. For radius fracture, patients with radius shaft fractures (S52.301A, S52.302A) and radius fracture nonunion (S72.301K, S72.302K) from 2017 to 2022 were included in the study data. For Ulnar fracture, patients with ulna shaft fractures (S52.201A, S52.202A) and ulna fracture nonunion (S52.201N, S52.202N, S52.209K) from 2017 to 2022 were also included in the study.
Additionally, fracture nonunion procedures were identified using the Current Procedural Terminology (CPT) of 25400, Repair, Revision, and/or Reconstruction Procedures on the Forearm and Wrist, to identify surgical patients from 2017 to 2022. Then, the further identifier CPT code of 25420, Repair of nonunion or malunion of the radius and ulna, further stratifying patients who received operative management. Statistical analysis for descriptive statistics such as mean, standard deviation, and frequency were calculated for all variables.
Demographical features
Patient information was obtained from the TriNetX database, which included age, sex, ethnicity, race, and smoking status. Age was divided into four specific quartiles, which included 0-17, 18-39, 40-64, and 65-90. Ethnicity was classified as either Hispanic or Latino, Not Hispanic or Latino, and unknown. Race was subdivided into White, Black, Asian, Native American or Pacific Islander, American Indian or Alaska Native, and unknown.
Global Collaborative Network
The Global Collaborative network through TriNetX is a web-based database tool allowing for population cohort research, feasibility queries, and collaboration with medical researchers worldwide. Over 250 million unique patient information forms the database that can be readily accessed for medical research. Additionally, the research does not require prior Institutional Review Board (IRB) approval due to its deidentified raw data format. The database allows access to patient demographics, diagnoses, procedures, labs, and medications. Over 200 community and academic medical centers worldwide partner with industry to form this database to further medical research.
Results
Radius Shaft Fracture
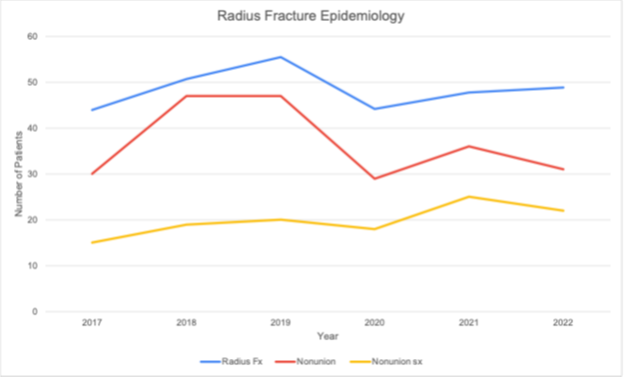
Between 2017 and 2022, 29,088 patients with radius shaft fractures were found in the searched database. Radius shaft fracture ranged from 4,399 in 2017 to 4,878 in 2022. Notably, there was a slight decrease in fracture incidence during 2019-2020, consistent with the Coronavirus disease-2019 (COVID-19) peak. [Figure 1, Table 1]

Radius Shaft Fracture Demographics
Regarding age and radius shaft fracture incidence, the highest rate was seen in the 0-17 age group and the lowest in the 65-90 age group. Radius shaft fracture was more common in males than female patients, with a 1.6:1 ratio. Non-Hispanic or Latino patients had a higher rate of radius shaft fracture. White patients were found to have the highest prevalence of radius shaft fractures at 68%, followed by black patients at 15% and Asian patients at 3.4%. [Table 2]
Radius Shaft Fracture Nonunion
From 2017 to 2022, 220 patients with radius shaft fracture nonunion were identified in the TriNetX database. The incidence rate for radius shaft fracture nonunion from 2017 to 2022 was 0.76%. The incidence of radius shaft fracture nonunion dropped from 0.9% in 2019 to 0.7% in 2020 before rising again to 0.8% in 2021. [Table 3]
Radius Saft Fracture Nonunion demographics
Radius shaft fracture nonunion had the highest incidence among the 40-64 age group (2.2%), followed by the 65-90 age group (1.6%). The 0-17 age group had the lowest incidence of fracture nonunion (0.33%) compared to all other age groups. Female patients (0.80%) had a slightly higher radius shaft fracture nonunion rate than males (0.73%). Hispanic or Latino (1.6%) patients had almost double the incidence of nonunion than non-Hispanic or Latino (0.81%). The highest rate of fracture nonunion was in Asian patients (3.1%), followed by Black patients (1.7%). Radius shaft fracture nonunion was higher in smokers (4.0%) than non-smokers (0.61%). [Table 4]
Radius Shaft Fracture Nonunion Surgery
From 2017 to 2022, 119 out of 220 patients with radius shaft nonunion underwent nonunion repair surgery. The overall rate of surgical management of radius shaft fracture nonunion was 54%.
Radius Shaft Fracture Nonunion Surgery Demographics
The rate of nonunion surgery was slightly lower in smokers than in non-smokers (50% vs. 55%). Data on age, sex, race, or ethnicity was not available for radius fracture nonunion surgical management. [Table 5]
Ulna Shaft Fracture
The total number of ulnar shaft fractures from 2017 to 2022 was 47,141 patients. The number of ulna shaft fractures between 2019 and 2020 saw a decrease in fractures during the COVID-19 pandemic. [Table 6]
Ulna Shaft Fracture Demographics
The highest rate of ulna shaft fracture between 2017 and 2022 was seen among those aged 0-17 (59%). Males (59%) accounted for a higher rate of ulna shaft fractures than females (40%) by a ratio of 3/2. Ulna shaft fractures were highest among non-Hispanic (70%) and white patients (69%). [Table 7]
Ulna Shaft Fracture Nonunion and Nonunion Surgery
During the study period of 2017 to 2022, 39 patients with ulna fracture nonunion were identified with an incidence rate of (0.08%). Ulna shaft fracture nonunion was more common in the age group of 40-64 (0.27%) and females (0.10%) than males (0.08%). Due to a small number of ulna fracture nonunion, the details of race, ethnicity, and smoking subgroups were not available. Eleven patients with ulna fracture nonunion were identified as having surgical management, representing 28% of all patients with ulna shaft fracture nonunion. [Table 8]
Discussion
While many patients are treated with conservative measures such as closed reduction and casting of radius and ulnar shaft fractures, many patients, especially the adult population, tend to receive primary surgical management of radius or ulna shaft fractures.27–29 Even among the pediatric age groups comprising patients under 16 years old, primary surgical management of radius and ulnar shaft fractures has increased rapidly in recent years. A study by Sinikumpu et al. found that primary surgical management of radius and ulnar shaft fractures from 2000 to 2009 increased from 13% in 2000 to 53% in 2009.23 Additionally, Sinikumpu et al. found that rates of nonunion amongst operative patients were 1.4% compared to 30.% in nonoperative patients. Nonunion rates among patients with surgically managed radius and ulnar shaft fractures are very low, around reported 2-4% of all fractures, which is attributed mainly to infection or metabolic disorders.18,30–32
While the study demonstrated that the highest rate of radius and ulna shaft fractures from 2017 to 2022 occurs among those aged 0-17 (radius =64%, Ulna=59%), the nonunion rates were much higher in older age groups, especially the 40-64 (radius=2.2%; ulna=0.27%) and 65-90 (radius=1.6%). The higher amount of fractures displayed among the youngest age group is consistent with current literature showing that radius and ulna shaft fractures occur predominantly in the pediatric population.4–6 Incomplete green stick fractures are only seen in the pediatric population, which may be a reason for a higher prevalence. The higher rates of radius and ulna shaft fractures in the pediatric population are multifactorial but largely attributed to skeletal immaturity and increased sports participation in the younger population.33–35 Some studies attributed better reflexes, musculoskeletal control, and faster walking speed to lead to the younger adult group falling on their hand, leading to forearm fractures, as opposed to the oldest group who may fall to the side on their leg and arm leading to a fracture of the hip, distal radius and humerus.36 The 40-64 age group tends to have the risk factors for nonunion such as smoking, obesity, hypertension, osteoporosis, and diabetes that you would be less likely to see in much younger patients.37 Many of these risk factors are also risk factors for premature death, so patients at highest risk of nonunion may not reach older ages and could possibly explain why the 65-90 group had a lower rate of nonunion than the 40-64 group.37
When looking at the effect on radius and ulna shaft fracture regarding patient sex, males had a higher overall rate of radius (61%) and ulna (59%) shaft fractures from 2017 to 2022 compared to female patients with radius (38%) or ulna (40%) shaft fractures. However, female patients had higher overall rates of radius (0.80%) and ulna (0.10%) shaft nonunion from 2017 to 2022 than male patients with radius (0.73%) or ulna (0.08%) shaft fractures did. The higher rates in young males are generally linked to increased physical activity and participation in high-risk sports such as football or wrestling.13 Due to the common skeletal development characteristics occurring in the pediatric population, many studies have indicated that risks of nonunion are similar regarding patient sex in the pediatric population.38,39 However, numerous studies have shown that females have a higher proportion of nonunion as patients age.4,6,29,40 The higher rates of radius and ulna shaft fracture nonunion in females after age 50 are largely attributed to osteoporosis and hormonal and cellular differences in bone healing in this population.6,38,41,42 A study by Bliuc et al. found that males had a higher age-matched mortality ratio post-fracture than female patients, which is a finding that has also been displayed in numerous other studies.43–45 This could indicate that males who suffer from radius or ulna shaft fractures might not live long enough post-fracture to develop and be diagnosed with nonunion, leading to higher overall fracture rates but lower nonunion rates observed.
Despite improved diagnostic and treatment methods, racial and ethnic minorities still tend to face worse health outcomes and higher morbidity and mortality than nonminority patients.46 Our study showed that white patients had a much higher rate of overall radius and ulnar shaft fractures (Radius= 68%, Ulna=69%) from 2017 to 2022 compared to Black (Radius= 12%, Ulna=12%) and Asian (Radius= 3%, Ulna=3%) patients as well as patients who identify as Hispanic or Latino (Radius= 13%, Ulna=12%). This follows trends in other studies that also found that white patients generally have higher rates of radius and ulna fracture rates than other races.47,48 Baughman et al. found that non-white patients had much lower rates of diagnostic imaging performed for traumatic arm or wrist pain compared to their white counterparts.47 Another possible explanation for lower rates seen in minority groups is that racial minorities have been shown to have lower levels of health insurance coverage and higher cost-sharing and out-of-pocket costs compared to white patients.49,50 This financial burden may keep minority groups from presenting to an emergency or ambulatory setting and receiving diagnosis and treatment of a fracture, potentially leading to the rates seen in the study. When looking at fracture nonunion among racial groups, radius shaft fracture nonunion was higher among Black (1.7%) and Asian (3.1%) patients than white (0.77%) patients. This could be again explained by previously discussed disparities in fracture diagnosis or patients not seeking care, as lack of proper fracture stabilization and management could potentially lead to nonunion.51 However, another major disparity has been found in numerous studies on treatment offered to racial minorities. A study by Landau et al. found that black patients were 43% less likely to be offered surgery after a closed forearm fracture and 35% less likely after an open forearm fracture.48 Another study by Dy et al. also found that among pediatric patients who received a closed fracture reduction who were non-white or had government health insurance were more likely to be seen at the emergency department within eight weeks with the same fracture diagnosis and those with private insurance were 28% less likely to have to return to the emergency department.52 Another study by Sabharwal et al. found that among pediatric patients with a closed fracture who presented for care, 55% of those with private insurance received orthopaedic care while only 22% with government health insurance received that same care.53 Additionally, Cruz et al. found that patients who had private insurance were more likely than those with Medicaid or other government-backed insurance to receive surgical intervention for their fracture, with non-white patients more likely to be in the government health insurance group than their white counterparts.54,55 This racial disparity in fracture treatment may explain higher rates of nonunion in racial minorities as proper initial fracture management surgical treatment has been shown to have lower rates of nonunion than conservative measures and those who did not receive the proper initial care.56–59 It is also important to note that while the Asian patient group had the highest overall nonunion rate at 3.1%, they comprised the smallest amount of the sampled population at 3% of patients and had no fracture nonunion reported in 2018, 2020, and 2021. This may indicate that these patient groups are not receiving care at the sampled health centers, or if they do receive care there, it is for fracture complications such as nonunion, leading to higher incidence rates.
When looking at radius and ulnar shaft fracture nonunion rates concerning race, it is also important to consider the disparities in medical comorbidities in minority populations that also increase the risk of fracture nonunion. A major gap seen in the African American community is higher rates of diabetes and insulin-dependent diabetes compared to other racial and ethnic groups.60,61 Diabetes and increased Hemoglobin A1c are factors that have been shown to increase the risk of fracture nonunion in patients who receive conservative and surgical management of their fracture.62–65 With African American patients facing disproportionately high rates of diabetes in the United States, this may also explain the higher rates of nonunion in minority groups seen in the study as their underlying increased rates of medical comorbidities, such as Diabetes Mellitus, are leading to an increased risk of fracture nonunion.
When looking at the effect of patient smoking history on radius and ulna fracture nonunion, even though the higher rate of fracture was among nonsmokers (Radius= 96%, Ulna=96%) than those who smoked (Radius= 4% patients, Ulna=4%), smokers had much higher rates of nonunion (4.0%) than nonsmokers (0.61%) did in the radius shaft fracture group. There was no data for nonunion based on smoking status in the ulna shaft fracture group. This trend has been observed in other studies as smoking causes physiologic changes such as vasoconstriction, hypoxemia, and decreased bone mineral density that can ultimately lead to fracture nonunion.66–69 Additionally, a study by Hernigou et al. showed that among patients with diaphyseal fractures, smoking led to higher rates of nonunion compared to patients who did not smoke.70 While smoking does increase patient nonunion risk, management of that nonunion is still standard amongst all patients regardless of smoking history.
The COVID-19 pandemic has had major impacts across the healthcare spectrum, and its effects on patient care and outcomes are still present today. Interestingly, the study showed the overall rate of radius and ulnar shaft fractures in 2020 (Radius= 15%, Ulna=16%) decreased compared to the previous year in 2019 (Radius= 19%, Ulna=17%) prior to the onset of the pandemic. The study also showed nonunion amongst radius shaft fracture patients decreased from 2019 (0.85%) to 2020 (0.66%) before rising in the years following the pandemic’s onset in 2020. Numerous studies have shown that overall rates of radius and ulna fractures decreased during the COVID-19 pandemic.71–75 This has been attributed to fewer people going out of their homes, which may put them at less risk for trauma, as well as some patients possibly avoiding seeking care due to fear of contracting COVID-19.71,73 However, it has been noted in several studies that patient outcomes post radius and ulna shaft fracture did not seem to deteriorate during the COVID-19 pandemic, with management of the fracture operatively and nonoperatively similar pre-pandemic years.76,77 A study by Sahoo et al. had a union rate of 93% in radius and ulnar shaft fractures during the COVID-19 pandemic that was comparable to rates before the pandemics onset.76
As a single healthcare institution cannot form the large heterogenous dataset needed to conduct this study properly, the TriNetX database collected patient information from 59 healthcare centers to better characterize demographic factors associated with radius and ulna shaft fractures.78 However, there are some notable limitations to this study. The data does not include the patient’s mechanism of injury, fracture pattern, functional status, or outcome. Therefore, conclusions or recommendations on fracture management cannot be made from this study. Additionally, the study does not account for patient factors such as insurance status, socioeconomic status, comorbidities, or geographic location.
With the rapidly globally changing patient demographic, pinpointing the underlying demographic and patient factors that drive health outcomes can help physicians better provide care and improve health equity for patients.
Declaration of conflict of interest
The authors have no relevant financial or non-financial interests to disclose.
Declaration of funding
There is no funding source for authors to declare.
Declaration of ethical approval for study
This study was exempt from the IRB review.
Declaration of informed consent
None of the information presented within this manuscript can be used to identify any patients.
Acknowledgments
We would like to thank Yusuf Mahmoud for data query