INTRODUCTION
Social determinants of health (SDOH) such as education level, economic stability, social and community context, health and health care, and the neighborhood and built environment have been recognized as important factors influencing various health outcomes.1 Contributing to SDOH is a person’s socioeconomic status (SES), a measure based on an individual’s education level, income, and occupation in relation to others.2 In orthopaedic surgery, these various SDOHs and an individual’s SES may contribute to disease development, risk of traumatic injury, access to health care, and outcomes following operative or nonoperative interventions, often reported as patient-reported outcomes (PROs).3 Although more research has recently focused on the association of certain SDOH on various PROs in orthopaedic surgery,3 it has yet to be clearly defined how factors such as education level, access to transportation, and an individual’s home environment influence self-reported outcomes in orthopaedic trauma patients.
It has been well-established that educational level impacts health through various mechanisms, including neurological development, health literacy, patient health behaviors, and providing patients with a sense of control and empowerment.4 Studies have further demonstrated that a lower educational level is a predictor for worse long-term outcomes following the surgical management of injuries such as fracture nonunions5 and unstable ankle fractures.6 Similarly, studies have found that a higher educational level is associated with higher health-related quality of life after total hip arthroplasty7 and total knee arthroplasty.8 Although more research has recently focused on the association of SDOH with various PROs in orthopaedic surgery,3 it is yet to be clearly defined how factors such as education level influence self-reported outcomes in orthopaedic trauma patients. Additionally, it is difficult to generalize results from non-orthopaedic trauma studies to a population of orthopaedic trauma surgery patients.
Further, a lack of transportation is a commonly cited barrier to healthcare access in the United States. Individually, poor transportation access can lead to missed appointments, delayed or irregular care, and lower healthcare utilization, particularly for people of lower SES and minorities.9 On a population level, transportation barriers to healthcare access are associated with worse population health10 and higher healthcare use and costs.11 However, while studies on transportation barriers to healthcare access have focused on delayed or missed appointments, medication use, population health, and healthcare use and costs, few have investigated the effects on patient outcomes, particularly after orthopaedic trauma surgery in urban areas.12–14 As such, there remains a paucity of data regarding the effect of transportation on PROs.
Interestingly, the relationship between the physical challenges the home environment can present and PROs has been largely understudied. Studies have shown that patients discharged to a non-home location are more likely to experience adverse events,15 which poses an issue considering that a large subset of orthopaedic trauma patients, such as those treated for hip fractures, are not immediately discharged home but rather to inpatient rehabilitation facilities16 or other alternative locations. Further, it is yet to be determined how physical challenges, such as stairs in the house, impact PROs over time.
This study aims to determine the association of patient-reported outcomes with social determinants of health, such as educational level, transportation access, and home environment in urban orthopaedic trauma surgical patients.
METHODS
Approval was obtained from the Institutional Review Board to conduct a study on patients who underwent orthopaedic fracture fixation surgery and who completed Patient Reported Outcome Measurement Information System (PROMIS) surveys at an urban academic level 1 trauma center clinic between April 16, 2019, and June 18, 2020. Surveys on these patient’s education level, access to transportation, and home environment were conducted by telephone between July 8, 2020, and July 17, 2020.
Patients were included in the study if they had undergone orthopaedic fracture fixation surgery, had previously completed at least one set of PROMIS surveys in the trauma clinic between two weeks and one year post-operatively, were between the ages of 18 and 89, and were English-speaking. Type, mechanism, and location of injury were not considered inclusion criteria to survey a broad range of trauma patients. Individuals who could not consent or complete the survey, including infants, children, teenagers, prisoners, and those with severe mental conditions, were excluded from this study. In total, 273 patients fulfilled the inclusion criteria.
A cross-sectional survey was administered to collect data on patient’s education level, access to transportation, and home environment. Regarding education level, patients were placed in a lower education group, as defined by achieving a high school education or less, or a higher education group, defined by completing any form of education past high school, such as college, vocational school, or graduate school. Informed consent was obtained from each patient before all data collection, and patient confidentiality was maintained throughout the study.
PRO data from the PROMIS surveys after orthopaedic trauma surgery was retrospectively evaluated. PROMIS was created by the National Institutes of Health (NIH) to provide validated and standardized measures of PROs.17 Three PROMIS surveys were administered by physician extenders via iPad at the orthopaedic trauma clinic just before the patient sees their orthopaedic surgeon between 2 weeks to 1 year post-operatively. The PROMIS-10 SF Global Health survey assessed patients’ overall physical and mental health and generated two composite scores, the Global Physical score (GP) and the Global Mental score (GM). The PROMIS Bank v1.1 – Pain Interference survey assessed how much pain interferes with patients’ daily lives and generated the Pain Interference score (PI). The PROMIS Bank v2.0 – Physical Function survey assessed patients’ self-reported physical performance capabilities and generated the Physical Function score (PF).18 For each score, 50 represented the mean score for the United States general population with a standard deviation of 10.17 For GP, GM, and PF, higher scores indicated better physical and mental health and function. For PI, a higher score indicated that pain interfered with their daily life to a greater extent.18
Patients’ cross-sectional survey data were correlated with their PRO scores. Data were expressed as counts and percentages for categorical variables and mean±SD or median (range or quartile range) for continuous variables. The normed physical and mental scores from the PROMIS-10 SF Global Health survey as well as the individual Pain Interference and Physical Function survey scores at each of the five (5) time points (2w, 6w, 3m, 6m, and 1y) were compared between age (18-39, 40-59, and ≥60), gender (female vs. male), race (white/Asian, black, vs. Hispanic origin), and education (High School or less vs. more than HS) subgroups as well as access to transportation and the home environment variables using both parametric (the equal or unequal variance t-test or ANOVA) assuming normally distributed data and non-parametric tests (the Wilcoxon rank sum or Kruskal-Wallis test) in case that the underlying study endpoint had a distribution that departed from normal; robust unadjusted p-values comparing the different subgroups of interest were obtained from this approach. In addition, a multivariable mixed-effects regression model was fitted to each of the same four (4) study endpoints pooling all the five (5) follow-up time points together to adjust for the various covariates, i.e., follow-up time, gender, age, and race while at the same time to account for the correlation among the observations from the same patients over time when simultaneously determining the associations of the education level, access to transportation, and the home environment variables with the study endpoint. However, covariates were kept in a final model only if they were significant (i.e., p<0.05). The modeling did not consider 2-way interaction terms between the time and any covariates to conserve the degree of freedom since the number of observations for this study was only moderate. Adjusted p-values and 95% confidence intervals comparing the various subgroups of interest were derived from multiple mixed-effects regression models with adjustments for the aforementioned covariates. Data transformation (e.g., log or square root) was considered when a variable on the original scale was not normally distributed. P-values less than 0.05 were considered statistically significant. SAS version 9.4 (SAS Institute Inc., Cary, NC) was used for all the data analyses.
RESULTS
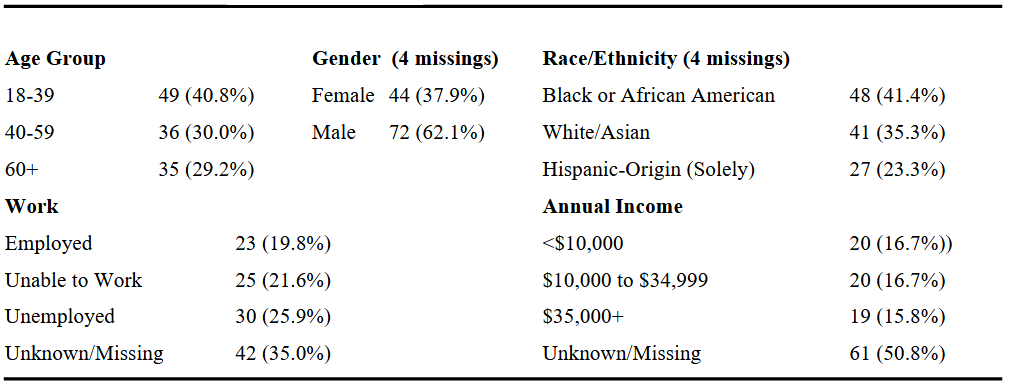
In total, 120 patients completed the cross-sectional survey and were included in the analysis. However, data availability for the various PROMIS scores varied depending on specific outcome reporting time (i.e., two weeks, six weeks, three months, six months, and one year). Data availability at each of the five reporting times are as follows: two weeks (n = 59), six weeks (n = 47), three months (n = 44), six months (n = 57), and one year (n = 19). Demographic data are displayed in [Table 1]. Univariable analysis results depicting statistically significant differences in PROMIS scores found among SDOH are summarized in [Table 2], and multivariable regression analysis results are depicted in [Table 3]. All statistically significant variables with associated p-values are listed in [Appendix 1].
.png)
Regarding demographics, males had better PF six weeks post-surgery than females (P=0.042). At six months, patients ≥60 years old trended better in GP (P=0.002), GM (P=0.034), and PI (P=0.047). Black and Hispanic patients trended worse than White and Asian patients in GP at six months (P=0.039) and in PF at one year (P=0.027). Patients who were unable to work trended worse than employed and unemployed patients in GP at three months (P=0.016) and one year (P=0.005), in GM at one year (P=0.02), and in PF at six months (P ≤ 0.001) and one year (P=0.008). Patients with <$10,000 in annual income trended worse in GP (P=0.011), PF (P=0.011) and trended better in PI at one year (P=0.036).
Education
Multivariable regression analysis demonstrated that patients in the lower education group reported better PF (P = 0.007) compared to those with an education greater than high school. Univariable results indicated this association occurred at two weeks (P=0.054) and six weeks (P=0.008).
Transportation
With respect to the patient mode of travel, patients who used a personal or borrowed car compared to those who walked, biked, took public transportation, or used rideshares trended better in GP at three months (P=0.006) and six months (P=0.027). Further, these patients trended better in GM at three months (P=0.005). At six months, patients who walked, biked, or took public transportation reported higher PF than those who used cars as their primary mode of travel (P=0.005). Patients who lived greater than 5 miles from the hospital trended better in GP at three months (P=0.007), GM at two weeks (P=0.012), and GM at three months (P = 0.044).
The multivariable regression analysis found that distance to the hospital was associated with increased GP score, with a distance greater than 5 miles having the highest score, followed by those who lived between 3-5 miles, and lastly, those who lived within 3 miles of the hospital (P = 0.0498). Further, whether patients had ride access to the hospital was associated with higher GM scores (P = 0.0164).
Home Environment
Patients who lived in an apartment had better GP (P=0.014) and GM (P=0.023) at three months and worse PI at six months (P=0.005). Patients who did not report trouble accessing the toilet or shower (i.e., bath accessibility) had higher GP at two weeks (P=0.044) and six months (P=0.017), higher GM at three months (P=0.031) and six months (P=0.01), and higher PF at two weeks (P=0.027) and six weeks (P=0.007). Patients who reported difficulty accessing the toilet or shower reported higher PI at two weeks (P=0.041) and six months (P=0.025). Patients who felt safe moving around home after their injury had higher GP at six months (P=0.013).
Patients who had to navigate stairs inside their homes had higher PF at six months than patients without stairs (P=0.048). Patients who had to navigate between 1-3 stairs in their home had higher PI (P=0.031) at two weeks than patients with no stairs or those with more than seven stairs.
Multivariable regression analysis demonstrated that patients who must navigate stairs to enter their homes had higher GP than those without stairs outside their homes (P = 0.038). Those who navigated one or more flights of stairs inside their home were associated with lower GP (P = 0.030) and higher PI (P = 0.0007) compared to those with no stairs inside their home. Lastly, those who reported no concerns with bath accessibility were associated with higher GP (P = 0.0072), GM (P = 0.0008), and PF (P = 0.0043) and lower PI (P = 0.0002) compared to patients that reported difficulty accessing their toilet or shower.
DISCUSSION
Numerous factors are correlated with patient-reported outcomes in patients who undergo orthopaedic trauma surgery. Some factors, such as education level, have been well-studied after medical or surgical interventions.5–7,19–22 In contrast, transportation and challenges in the home environment have not been thoroughly studied in the context of postoperative outcomes in orthopaedic trauma surgical patients.
Prior studies have found that lower-income and minority patients have worse outcomes following orthopedic surgeries.5,23–25 Univariable analysis in our study shows that Black and Hispanic patients trend worse in global physical health at six months and lower physical function at one year post-operatively. We also demonstrate that patients earning <$10,000 in annual income trend worse in global physical health, have increased pain interference in daily functions, and report lower physical function at one year post-operatively. Interestingly, our study found that patients aged ≥60 years old reported better global physical health, global mental health, and lower pain interference than younger patients.
Prior studies have found education level positively correlated with better long-term health outcomes.5–7,19–22 In contrast to such findings, this study found that the lower education group reported better physical function in the early postoperative period (two weeks and six weeks), while there were no significant differences found in pain interference, global physical, or global mental health scores. It is not known why patients with lower education levels reported better physical function at two and six weeks. This significance may be due to the smaller sample size or the nature of patient-reported outcomes. More focused studies looking at the impact of education on patient-reported outcomes are needed to discern further the association we found in this study.
The results on transportation access indicate that missing or rescheduling appointments due to a lack of transportation may lead to worse outcomes than patients with no appointment issues due to transportation. These results align with earlier studies in terms of missed appointments leading to worse outcomes26 and a lack of transportation leading to missed appointments.12-14. The univariable analysis also suggests that patients who normally drive themselves using a personal or borrowed car before surgery tend to fare better, while patients who normally have someone else drive them tend to fare worse. The literature lacks the effects of transportation barriers and modalities on postoperative outcomes. Still, it may be that patients who normally drive themselves are more physically independent at baseline, which could contribute to their better outcomes. The results are inconsistent over an extended period, and a larger sample size would be useful in identifying more apparent trends.
In addition, the univariable results indicate that individuals who drive themselves to follow-up appointments report better outcomes. However, this association was not found in the multivariable regression analysis. However, directionality cannot be determined regarding whether those transportation modalities are causing them to have worse pain and function or if their pain and function are causing them to utilize those alternative transportation modalities. Additional questions can be built into future studies to elucidate this further.
Distance also seems to affect outcomes as patients who live within a mile from the hospital and patients who live >5 miles from the hospital tend to fare better than those in the 1–5-mile range. Patients who live >5 miles from this urban medical center likely live in the suburbs, which means they may be more likely to travel by car, a marker of socioeconomic status, compared to those living in the dense urban environment surrounding the hospital. Patients who live in the city may face additional challenges of the urban environment and may be more likely to travel by public transport or rideshares, thus facing a greater physical and financial barrier. Existing literature has found mixed evidence regarding distance and transportation barriers but has no data on patient-reported outcomes.9,12.
Our results suggest that housing type, accessibility of the toilet and shower, and the use of stairs after returning home may play a role in patient-reported outcomes. Patients who live in apartments reported better outcomes between three and six months after surgery when compared to patients who live in houses. This difference may be due to a residence in an apartment generally being a single floor, so the absence of stairs within a residence may play a role. Our results suggest that less utilization of stairs is associated with better outcomes.
Patients reporting no difficulty accessing the toilet or shower had better PROMIS scores at several time points after surgery. These trends suggest that there may be a correlation between difficulty getting into the shower or accessing the toilet and all four PROMIS scores measured. Several factors, such as a ledge on the shower/bathtub or a small bathroom that is not easily maneuverable, could lead to difficulty accessing them; however, patients were not asked to identify what made it difficult to access. It also may be possible that increased pain or decreased physical function because of the surgery led to difficulty using the shower or toilet. The survey question combined difficulty accessing the shower and toilet into one question, so it is unknown if one has more association than the other. Additional questions should be implemented in future studies to elucidate this point further.
There are various limitations in this study. While 120 individuals ultimately completed the cross-sectional survey, not every patient surveyed had PRO data at each time point, leading to an average of only 45 patients per time. This limitation may have the effect of either leading to statistical significance among groups that would otherwise not have any difference or leading to a lack of significance when it would otherwise be found to be statistically significant. Reporting bias is also possible, as PROMIS scores and the cross-sectional survey were all gathered from questions posed directly to patients. Further, it is important to note that patients completed the surveys at varying times from their initial surgery, between 2 weeks post-operatively and one year post-operatively. Considering the cross-sectional design of this study, we acknowledge recall bias as a limitation in this study. The sample used for this study was also based around an urban trauma center, which may not be generalizable to rural or suburban settings. Finally, this study does not differentiate among patients based on the type of orthopaedic trauma surgery they sustained, such as whether they were poly-trauma cases, isolated extremity injuries, or other.
CONCLUSION
There are some promising insights with regard to education level, transportation, and the home environment and their potential impact on patient-reported health outcomes within our study population. This is one of the first studies to look at the effects of transportation and the home environment on outcomes following orthopaedic trauma surgery. Future studies will need to be conducted using a larger sample size, with patients from different geographical settings, and differentiating patients based on their orthopaedic trauma further to delineate the associations between such SDOH and PROs.
Declaration of conflict of interest
The authors do NOT have any potential conflicts of interest for this manuscript.’
Declaration of funding
The authors received NO financial support for the preparation, research, authorship, and publication of this manuscript.
Declaration of ethical approval for study
The Institutional Review Board has approved the study with the IRB #27075.
Declaration of informed consent
There is no information (names, initials, hospital identification numbers, or photographs) in the submitted manuscript that can be used to identify patients.
Acknowledgments
N/A