Introduction
Treatment of peripheral nerve injuries occurring in association with closed fractures remains controversial. This is particularly true regarding a radial nerve injury in the setting of a closed humerus fracture.1,2 Observation is often recommended as the first step in treatment due to fair rates of spontaneous radial nerve recovery and poor results of radial nerve repair.2,3 However, the studies on which this recommendation is based are retrospective, non-controlled, and do not define recovery with any validated motor or sensory assessment measures.1–4 Additionally, since the formation of this recommendation, many advances have been made regarding the surgical management of nerve injuries,5–10 which may offer a surgeon solutions not previously available during a radial nerve exploration.
Although we are learning more and more about peripheral nerve healing, the influence of the stability of the skeletal and soft tissue environment on the nerve healing process has yet to be determined. Rats have been adopted as an accepted model for studying nerve injury, as their nerve tissue is virtually indistinguishable from that of humans, and investigators have detailed reliable functional and histological outcomes of nerve healing.11–14 The present study aims to assess the effect of rigid internal skeletal fixation upon nerve healing in a rat model. The experimental model involves an induced sciatic nerve axonotmesis injury with a concomitant, ipsilateral femoral shaft fracture. Our experimental hypothesis is that rigid internal fixation and a more stable soft tissue environment will lead to improved healing of a peripheral nerve injury.
Methods
Animals
Thirty-six male Lewis rats were divided into one of two experimental groups. Institutional Animal Care and Use Committee approval was obtained prior to the initiation of this study. Standard protocol was followed for anesthesia and pain management of the animals during and after surgery.15,16
Experimental Design
Surgical procedure
All surgical procedures were performed aseptically using microsurgical techniques under loupe magnification. Animals were premedicated for pain control with sustained release buprenorphine and anesthetized with inhalation of isoflurane via a nosecone. Exposure was achieved through a gluteal muscle-splitting approach, and a unilateral, right-sided sciatic nerve crush axonotmesis was created by closing a straight serrated mosquito hemostat to the first ratchet around the sciatic nerve 10 mm proximal to the trifurcation. The site of injury was tagged with an 8-0 nylon epineural suture. Next, the femur was exposed, and at the same level as the nerve injury, a transverse fracture was created using a sagittal saw. Animals in the first group underwent immediate open reduction internal fixation (ORIF) with a stainless steel plate and screws (Synthes, 2.0 mm plate, and 2.0 mm screws). Animals in the second group were treated non-operatively (NON) without internal fixation or bracing. In all animals, muscle and skin were reapproximated, anesthesia was reversed, and the animals recovered and were monitored for post-operative complications.
At each of 6-time points relevant to different stages of nerve degeneration and regeneration (1 week, 2 weeks, 4 weeks, 6 weeks, 8 weeks, and 12 weeks), three animals in each group were reanesthetized, and the incision was opened. Neurolysis was performed to expose the sciatic nerve, and limb assessments were performed to obtain the maximum isometric tetanic force of the tibialis anterior, sciatic nerve conduction velocity across the zone of injury, weight of the tibialis anterior muscle, and axon counts. At each time interval, the data was recorded in a non-survival fashion such that it was a final endpoint for each rat involved in the study.
Outcome Measures
Outcome measures include electrophysiology, muscle mass, and histomorphometry data.
Electrophysiology
Nerve Conduction Velocity
After neurolysis, the nylon suture marking the injury site was identified, micro-hook electrodes were placed around the sciatic nerve on either side of the zone of injury, and a grounding electrode was placed in the ipsilateral gluteus maximus muscle. A bipolar pulse stimulator (Model 2100, AD Instruments, Colorado Springs, CO) provided the electrical stimulus to the sciatic nerve, and the downstream recording electrode signal was fed through a signal amplifier (AM3000 with Headstage (single channel) (AD Instruments, Colorado Springs, CO). The analog output from the amplifier was converted into digital input into a personal computer via a data acquisition unit (USB-6001 14-Bit 20 kS/s Multifunction I/O and NI-DAQmx, National Instruments, Austin, TX) and interpreted utilizing LabVIEW software (National Instruments, Austin, TX).
Dynamic Muscle Force
After conduction velocity measurements were performed, postoperative motor recovery was assessed by measuring the maximum evoked force production of the tibialis anterior muscle. The tendon was released from insertion, and the muscle was freed from the surrounding tissue while preserving its neurovascular pedicle. The hind limb was secured to a testing block with 1-2 transosseous K-wires (Stryker Orthopaedics, Mahwah, NJ) through the tibia. The distal tibialis anterior tendon was released from its bony insertion and secured into a custom clamp fashioned from a modified surgical hemostat attached to a force transducer (MDB-2.5, Transducer Techniques, Temecula, CA). The force transducer signal was processed utilizing the same amplifier, data acquisition unit, and software mentioned above. The clamp was positioned so the tibialis anterior muscle was similar to its anatomical position and set at its resting length. The force transducer was mounted on an adjustable lever arm, which was used to adjust muscle tension. The same bipolar stimulator and micro-hook electrode delivered the electrical stimulus. The optimal electrical stimulation settings (muscle length, stimulus intensity, pulse duration, and pulse frequency) were determined prior to measurement of the maximum isometric tetanic force following the methods described by Shin et al.14 Because the ORIF was evident at the time of data collection for force analysis as well as nerve conduction recording, this data was measured in a nonblinded fashion.
Muscle Mass
Once force testing was complete, the tibialis anterior muscle was carefully dissected and released from its origin on the proximal tibia. The entire muscle with its associated tendon was weighed.
Histomorphometry
Nerve samples were then harvested from one centimeter proximal to the nylon suture to the trifurcation of the sciatic nerve. Nerve samples were prepared and stained following the methods described by Di Scipio et al.17 The nerves were fixed in neutral buffered formalin in phosphate-buffered saline solution for 2 hours. Then, the nerves were immersed for 2 hours in 2% osmium tetroxide (Sigma Aldrich, St. Louis, MO), also in a phosphate buffer saline solution. The nerves were then dehydrated by an increasing alcohol series starting from 30% ethanol with numerous passages. The specimens were then embedded in paraffin, and thin sections from the distal end of the nerve were cut and mounted. Pictures of each section were taken at 25x, 100x, and 400x magnification using a microscope with a mounted camera and image acquisition software. Cross-section areas (CSA) of the entire nerve were measured at lower magnifications (25X) by circumscribing the nerve tissue and then applying digital software to convert the image to a cross-sectional area based upon magnification. Axon counts were performed at the highest magnification (400x) under the oil for the largest diameter fascicle at the center of the nerve. The center of the nerve was determined by the use of intersecting lines. The first line was drawn along the greatest diameter of the fascicle, and a perpendicular line was then drawn at the greatest width point. A preset circle with a radius of approximately 50 microns was placed at this center point to facilitate hand counting axons within this region of the largest fascicle. The histologic analyses (Cross Sectional Area and Axon Counts) were performed in a blinded fashion. Toluidine blue stain (Sigma Aldrich, St Louis, MO) was added for the axon counts
Statistical analysis
Independent t-tests were performed to measure the statistical significance between ORIF and NON groups. All subgroups were analyzed for statistical significance at each time point, and then the data was pooled for all time points for each test performed. For all comparisons, a P less than .05 was considered statistically significant. A power analysis was performed to determine the number of rats needed in each group to detect significant differences in the primary outcome, maximum isometric tetanic force. Based on previous studies, it was determined that a sample of 15 rats in each group would provide 80% power to detect a difference in mean muscle force of 11% between any two groups in means at an alpha of 0.05.15
Results
Thirty-six animals were included in the study. Three animals expired prior to the final functional assessment and determination of healing. Outcome measurements of the ORIF group (n=17) and the NON group (n=16) were obtained.
Electrophysiology
Nerve Conduction
The mean sciatic nerve conduction velocities are shown for the individual subgroups, including standard deviations, in Table 1.
In the different subgroups, the nerve conduction was significantly greater in the ORIF group compared to the NON group at both the four and 6-week timepoints (p = 0.003 and 0.046, respectively). Mean sciatic nerve conduction velocity across the zone of injury was significantly greater for the overall ORIF group (111.53 mm/s, SD = 5.17) than the NON group (104.62 mm/s, SD = 5.44) (P=0.048).
Dynamic Muscle Force
The mean maximum force generations for the anterior tibialis muscles are shown for the individual subgroups, including standard deviations, in Table 2.
Among the different subgroups, the muscle force was significantly greater in the ORIF group than in the NON group at six weeks (p = 0.046).
The mean maximum isometric tetanic force was significantly greater for the overall ORIF group (0.45 lbs, SD = 0.20) than the NON group (0.27 lbs, SD = 0.10) (P=0.049).
Muscle Mass
Mean tibialis anterior muscle weights were not significantly different between the ORIF group (0.758g, SD = 0.199) and the NON group (0.746g, SD = 0.182) (P= 0.92)
Histomorphometry
Cross-Sectional Area
Overall for all the groups combined, the CSA for the ORIF group (0.28 mm2, SD = 0.15) was statistically greater than that for the NON group (0.19 mm2, SD = 0.10) with (P = 0.04). In the subgroup analysis, the one-week group achieved statistical significance (ORIF 0.48 mm2, SD = 0.036 vs. NON 0.22 mm2, SD = 0.069, P = 0.04).
Axon Counts
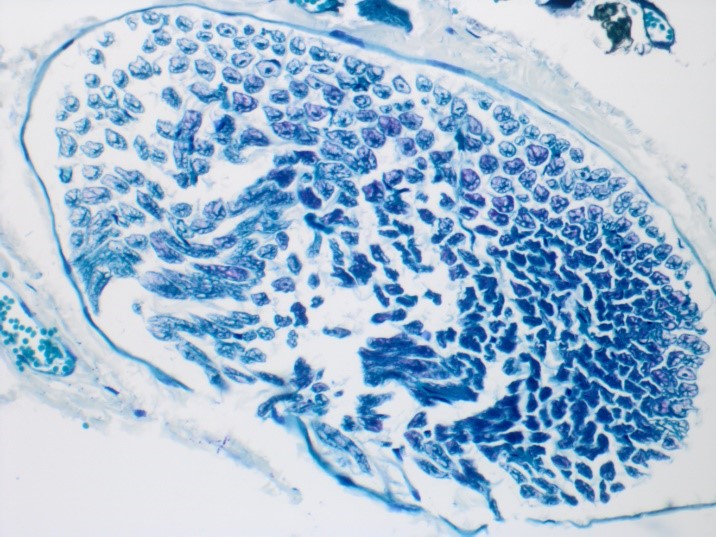
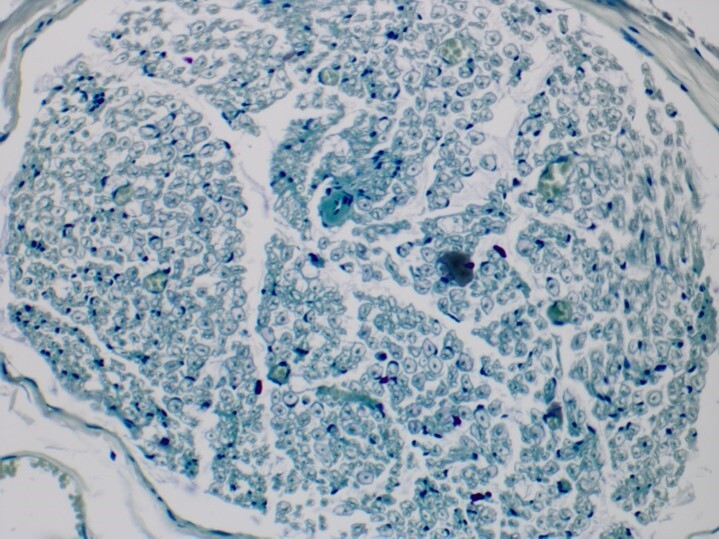
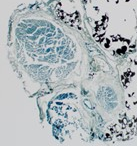
Axon counts overall were found to be higher, in general, for the ORIF group (186, SD = 73.0) than the NON group (145, SD = 44.6), but this did not reach statistical significance (P=0.24). None of the subgroups reached statistical significance in direct comparisons. Images of a sciatic nerve from the nonsurgical leg, an ORIF leg, and a NON ORIF leg, all at 12 weeks postoperative, are shown in Figures 1, 2, and 3, respectively.
_of_the_sciatic_nerve_specimen_from_the_uno.png)
_of_the_sciatic_nerve_from_a_leg_that_underwent_o.png)
_of_a_sciatic_nerve_from_a_leg_that_did_not_under.png)
Fracture Healing
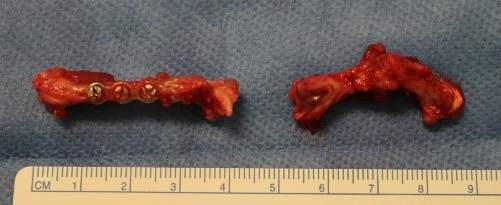
In the ORIF group, all fractures were fully healed in the later groups (4,6,8,12 weeks), as visualized by direct inspection of the fracture after hardware removal at the time of euthanasia. In the one and 2-week survival groups, the ORIF was stable with evidence of early healing at the time of euthanasia with no loss of reduction or stability. In the NON group, all fractures went on to either malunion or nonunion. Some early attempts to cast the NON group failed as the rats rejected any cast or splinting materials.
_and_nonorif_(right)._the_or.png)
Figure 4 shows 2 of the surgical femurs after explantation for analysis. The ORIF femur is to the left in Figure 4, with a four-hole plate and screws still attached. Pictured to the right is a femur in the NON group. The NON ORIF femur shown is a stable, fibrous non-union.
Discussion
Our study supports superior nerve injury healing in a stable mechanical environment, wherein the fracture was treated with ORIF. The electrophysiologic data supported greater nerve conduction velocities and force generation for the healing nerves in a more stable (ORIF) mechanical environment than in an unstable (NON) environment. Our histology also supported superior healing in the ORIF group. The CSAs were superior in the ORIF group. Though the axon counts did not reach statistical significance, they also favored nerve healing in a stable environment.
Historically, peripheral nerve injuries with associated fractures have been treated with non-operative management. A randomized clinical trial in this area can be difficult due to the low frequency and heterogeneity of these injuries. We believe that our study, with its limitations, does begin to shed some additional light on this question. Since the formation of non-operative treatment recommendations, many advances have been made regarding the surgical management of nerve and skeletal injuries, which may offer a surgeon solutions not previously available. Principles of nerve regeneration include providing a tension-free environment and an unobstructed endoneurial pathway across the zone of injury. For instance, it is known that if a nerve reaches a strain threshold of just 12%, it will undergo irreversible ischemic changes.18 Furthermore, it has been shown that cyclic sub-threshold strain can also lead to irreversible ischemic changes.19 We hypothesize that increased skeletal stability diminishes the absolute and cyclic tensioning of a neighboring regenerating nerve, which explains our experimental findings.
Some limitations to our study exist. A limitation of our study is the small number of rats in each group. And the data was analyzed in pooled fashion as well as in individual subgroups. This was by design of the original study to explore this challenging topic. We are not aware of similar animal studies exploring this critical topic. Based on our power analysis, our study goal was to assess differences with as few animals as possible. Based on the information from our study, a similar study could be repeated with a larger number of subject animals or in a larger animal model to better extrapolate and generalize these findings. In addition, functional data such as a sciatic functional index could be recorded to add additional data to the study. Such other work in an animal model could be essential to understand the translational impact of our findings better.
Conclusion
In conclusion, this study provides information about the influence of the stability of the skeletal and soft tissue environment on the nerve healing process. The significantly greater maximum force generation and conduction velocity observed in our ORIF versus NON group supports our hypothesis that rigid internal skeletal fixation of a fracture leads to superior recovery of a concomitant nerve injury. In the future, it would be interesting to include larger numbers of animals so that the time-based subgroups are powered to see early and late patterns of nerve recovery and eventually translate this type of investigation into human studies.
Declaration of Fundings
The Cooper Foundation Grant, Rowan University Camden Health Research Initiative Grant
Declaration of conflict of interest
The authors do NOT have any potential conflicts of interest in the information and production of this manuscript.
Declaration of ethical approval for study
Ethical and research approval was obtained through the Institutional Animal Care and Use Committee of Rowan University
Declaration of Informed Consent
There is no patient information contained within this manuscript.